-
Posts
2728 -
Joined
Content Type
Profiles
Forums
Store
Downloads
Recruiting - 2020
2019-2020 Football Season
Football
Entertainment
Sports
News and Business
Cloak Room
Transfer Portal
Recruiting
Events
Everything posted by heso
-

Could this be the craziest coaching carousel of all time?
heso replied to GreenspointTexas's topic in Football
-
Was a pretty obvious pass interference on UFs last drive. Flag gets thrown, but they pick it up. Pretty terrible call in that situation.
-
23 isn’t better than 20? I think at this spot you have to go for it.
-

Could this be the craziest coaching carousel of all time?
heso replied to GreenspointTexas's topic in Football
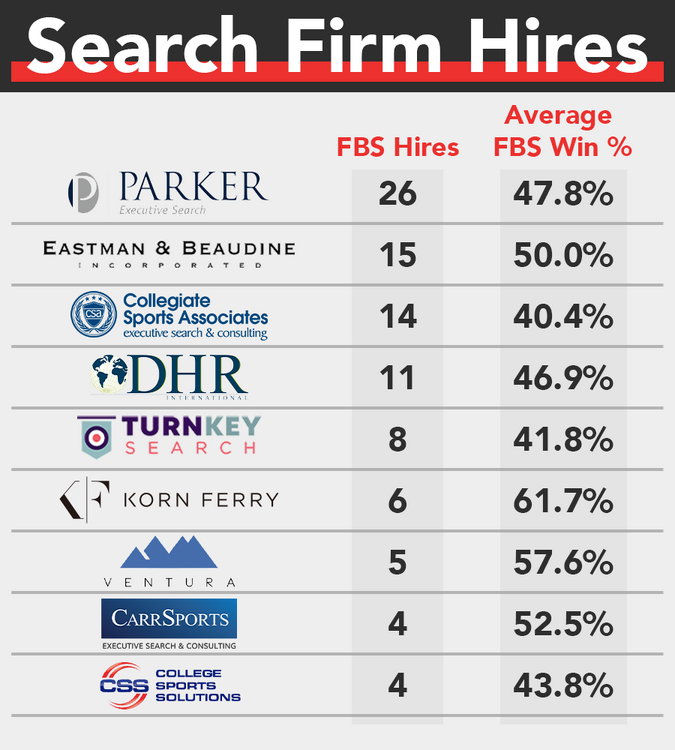
Search firms used in head coaching hires 2008-2020. Korn Ferry’s record boosted heavily by telling Michigan to hire Harbaugh, which seems hilarious that UM needed to pay $250k to a firm for that one. -
Looking through their website it seems like it’s the Harbinger mash bill. 60% yellow dent corn, 30% bloody butcher corn, 5% floriani flint corn, 5% elbow rye). The Ironroot website doesn’t give the % but the harbinger is the only one with that combo. So I guess it’s essentially a harbinger double oak single barrel.
-
They hired the aggy AD who gave Jimbo his contract. Apparently he’s friends with the osu pres who is part owner in a crypto mining company. And this would get osu an unequal payout from the PE money. They are running the athletic department at a massive loss despite being one of the top schools in revenue and need short term cash to balance their budget. They are more than happy to sell out the rest of the conference long term if it looks good for them in the short term.
-
Just got this one in the mail. I hadn’t heard of Ironroot before I found this bottle, but happy to see them well regarded here. Lost lantern is an independent bottler that buys individual barrels from small distillers. Their flagship products are blends of these barrels and then they also have a single cask series. I keep an eye on breaking bourbon’s reviews to see if any of the seasonal releases are unusually good in their eyes. Obviously whiskey reviews are highly subjective, but I’ve yet to be disappointed by something that rated very highly. Of the 2000+ reviews they’ve done only ~60 have gotten 4.5 / 5. Since value is one of their ratings, things that are solid and cheap get a boost while really good but overpriced limited releases get dinged so there a TON of bottles that get 3-3.5 and a decent amount that get 4. So when I saw this come in at 4.5 I was very happy to see that it was still in stock. It was sold out by the next morning. https://www.lostlanternwhiskey.com/product/ironroot-republic-double-barrel-bourbon/
-
I worded that poorly but what I meant was the relative comparison of the 35 year old who paid the cost of financing a house and paying mostly interest early in the life of the loan comparing negatively with the 35 year old that couldn’t afford to buy a house so they rented and invested some amount, and then revisiting those people’s net worth in 10 years when the early home buyer had a paid off house and the late home buyer has now purchased a house and gotten into the housing market later after years of renting. It was a massive oversimplification.* Regardless of why, boomers at a median generation age owned 33% of the household real estate wealth. Gen X owned 20% at the same age. Millennials 16%. At 50 boomers owned 49% and gen X 30%. And those later generations didn’t just buy stocks instead of homes. At 35 boomers owned 20% of all household wealth. Gen X 9%, millennials 8%. At 50 boomers had 47%, at 50 gen X had 25%. *edit: I’m also a moron, so that’s probably all wrong.
-
How much of that difference in net worth is the fact that a lower percentage of millennials and even lower for gen z have taken on a mortgage at that age range. If the study is looking at median net worth for 26-40 year olds, first time home buyer age is up from 28 to 38 since the mid 1980s. what percentage of boomers and gen X had a mortgage that they hadn’t yet paid significantly into the principal. Whereas there are more millennials and gen z that haven’t been able to buy a first home, so they don’t have the negative net worth from the mortgage. What will those net worths look like at 40-50 when the boomers have paid off houses vs millennials and gen z either still renting or are earlier into the mortgage payoff schedule.
-
It’s Chicago selling its parking meters in 2008. 15 years into a 75 year lease the investors had already recouped their $1.1 billion investment + $500 million. The deal was made even worse because if a street is closed for a parade or marathon or whatever, the city has to pay the company for the lost revenue. Parking rates were jacked up immediately. Areas that were previously free overnight turned into 24 hour pay parking. The city and the citizens lost massively on the deal for a short term cash infusion that the city burned through in 2 years. All it did in the long term was siphon money out of the city and its citizens.
-

Could this be the craziest coaching carousel of all time?
heso replied to GreenspointTexas's topic in Football
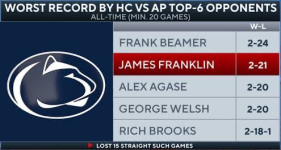
I think 10-2 is completely safe at 90% of schools. It all comes down to the expectations of the donors. Look at Ferentz. 8-4 to 10-2 every few years is good enough there. But it’s also boosted by him occasionally giving the fans an all time upset at home. He’s got a least half a dozen wins over top 10 teams and has knocked off OSU, PSU, and UM when they had a top 3 ranking. 10-2 gets you in the playoff at any P4 school almost every year now. A few seasons of 10-2 would get Ryan day fired if the losses were to Michigan and didn’t include deep playoff runs or better. I think there are a handful of schools that are definitely in danger of expecting too much. UF and Auburn both felt warranted. Neither of those guys were showing any real signs of improving their teams. I was a little surprised at LSU pulling the plug on Kelly this year, even though I thought that was never a good fit. But they brought in the top transfer class and he got worse with it. The biggest question with new hires is how long do schools give them to show improvement. With Franklin it felt like it was always going to get to this point but he always did just enough to keep it going. The decade of being unable to beat a top team because he coaches scared, having to fire 3 of 5 OCs, being unable to develop a qb or hire someone who could, finally getting g his 5* gunslinger and coaching him to play scared for years, not being able to tell if the qb he had could win a championship. There were other failures but the two main things that sunk him were the mismanagement of the QB position and the inability to ever win a big game. Then, if he can’t win the big games, he couldn’t afford to produce back to back weeks of decades old failure records. -

Could this be the craziest coaching carousel of all time?
heso replied to GreenspointTexas's topic in Football
Everyone sees what happened at Indiana and thinks they can just throw money at the problem and be a top 5 team overnight, ignoring the mountain of failed coaching hires. With how quickly that team changed, ignoring how soft their schedule was last year and they lost the only two games they played, people won’t have patience for anything less than immediate success. If our coach can’t get us to the national championship, we can just hire the next Cignetti and buy him a fresh team. Penn state is more likely to end up with a coach that they fire in 4 years than one that will win them a national championship. -

Could this be the craziest coaching carousel of all time?
heso replied to GreenspointTexas's topic in Football
Which is exactly why Franklin is the wrong coach for this era. He’s a salesman and little more. If a school needs a brand builder, a fundraiser, he’s good at that. But when money can build you a team without a years long recruiting development process, schools like Indiana can become playoff teams in 1 offseason with a good coach. He’s a terrible game planner against equal or better talent. He doesn’t do defense. He’s had to fire 3 of the 5 OCs he’s hired. He coaches scared in big games. He can’t develop a quarterback and doesn’t know how to hire someone who can. He cant identify when a quarterback has the quality to win a national championship and isn’t able to bring one in through the portal who can. -
-
I couldn’t get this to save as a gif to post, but worth the click to watch it spin. https://weather.cod.edu/satrad/?parms=meso-meso1-02-96-0-100-1&checked=usint-map&colorbar=undefined
-
Psu called a timeout on the first attempt at the kick and it came up 10 yards short, but Iowa tried it again anyway.
-
Iowa up 10-7 on psu with 0:06 left in the half they try a ~65 yard field goal. Gets blocked, psu scoops and runs it back for a td to end the half up 14-10
-

Could this be the craziest coaching carousel of all time?
heso replied to GreenspointTexas's topic in Football
And that will bring Penn state's NHL draft picks on the roster to 4. Those other schools are probably at 10-15. And that’s why PSU probably still falls short of those teams in the playoffs. -

Could this be the craziest coaching carousel of all time?
heso replied to GreenspointTexas's topic in Football
Yes, but he’s going to be the first pick in the next NHL draft. -
I was hoping they’d hire Brady as OC when they fired Yurcich since he was a GA at Penn state early in Franklin’s tenure, but he was very shortly thereafter made OC in Buffalo. Seems like he’s an NFL guy and a good bet for an NFL head coach job. I do wonder what if any relationship he and Pegula have.
-
Apparently Franklin tried to get a contract extension this past summer. With 6 years left on a 10 year contract. Thought he deserved it after making it to the semifinals last year.
Football ... Basketball ... Baseball ... Other Sports ... Futbol ... 🤫995🤫 ... Gambling ... Movies & TV ... Music ... Hobbies ... Lulz ... Food & Travel ... Daily Texan ... Business and Markets ... Cloak Room ... Help ... For Sale ... Board Discussion ... Subscribe!... Donate!... COOKIE MONSTER!


